2026-08-12 • 6 min read
Right-Sizing a Production MongoDB Cluster: M50 → M40
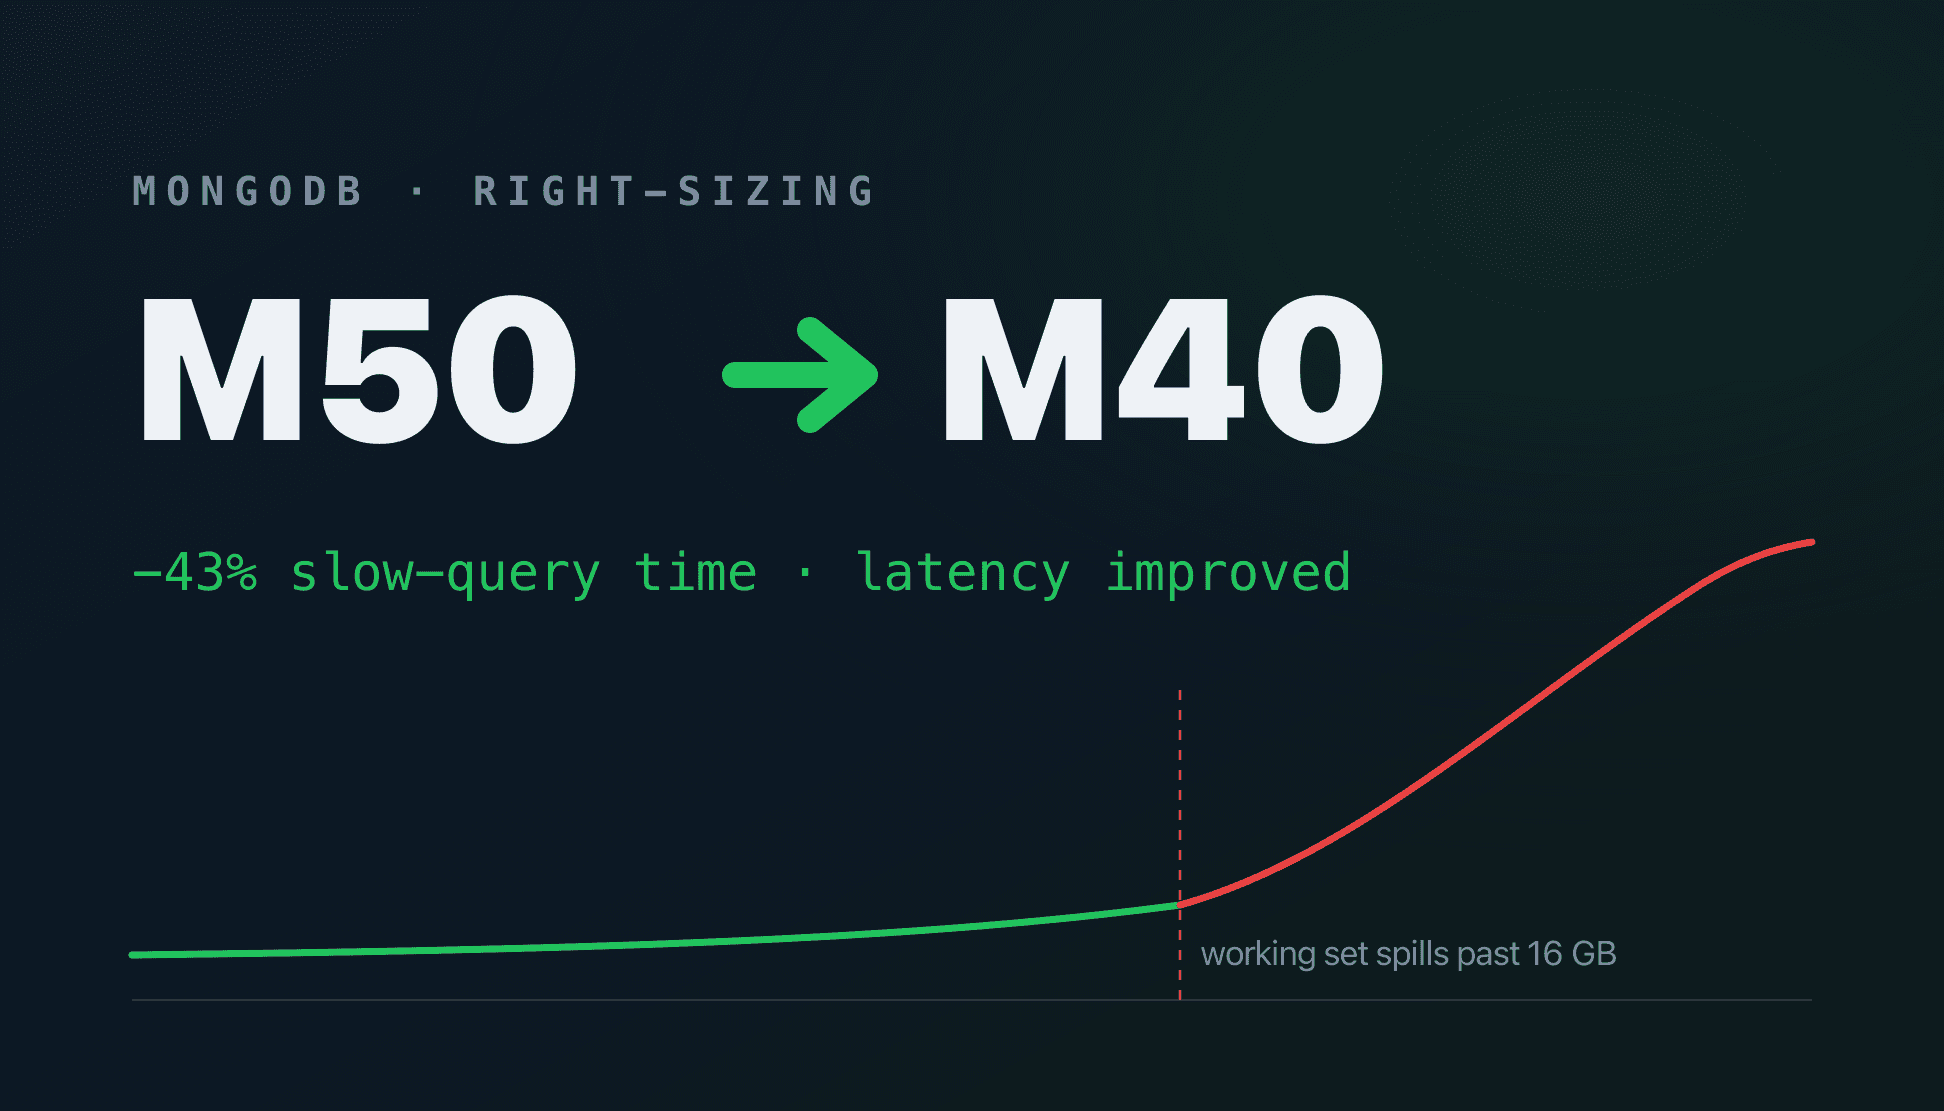
You can't just click "downgrade" on a production database. Here's the log forensics, index surgery, and aggregation rewrites that shrank the working set enough to take a MongoDB Atlas cluster from M50 to M40, a full tier down, slow-query time down ~43%, and latency that improved through the cut.
The cluster was a tier too big, but you can't just downgrade
A production MongoDB Atlas cluster I worked on was running on an M50. The metrics said it was oversized: CPU mostly idle, plenty of headroom. The obvious move was to drop it to an M40 and pocket a full tier's worth of monthly spend.
The problem is that "downgrade" isn't a billing toggle. An M40 caps out at 16 GB of RAM, and MongoDB lives and dies by whether its working set, the indexes and hot documents it touches constantly, fits in memory. The moment your working set spills past RAM, you fall off a cliff: cache eviction, disk reads on the hot path, and tail latency that goes from milliseconds to seconds.
%22%20x%3D%2228%22%20y%3D%22152%22%20text-anchor%3D%22middle%22%20font-family%3D%22ui-sans-serif%2C%20system-ui%2C%20sans-serif%22%20font-size%3D%2212%22%20fill%3D%22%23a1a1aa%22%3Ep99%20latency%20%E2%86%92%3C%2Ftext%3E%0A%20%20%3Ctext%20x%3D%22376%22%20y%3D%22284%22%20text-anchor%3D%22middle%22%20font-family%3D%22ui-sans-serif%2C%20system-ui%2C%20sans-serif%22%20font-size%3D%2212%22%20fill%3D%22%23a1a1aa%22%3Eworking%20set%20size%20%E2%86%92%3C%2Ftext%3E%0A%20%20%3Cline%20x1%3D%22430%22%20y1%3D%2250%22%20x2%3D%22430%22%20y2%3D%22250%22%20stroke%3D%22%23ef4444%22%20stroke-width%3D%221.5%22%20stroke-dasharray%3D%225%205%22%2F%3E%0A%20%20%3Ctext%20x%3D%22430%22%20y%3D%2244%22%20text-anchor%3D%22middle%22%20font-family%3D%22ui-sans-serif%2C%20system-ui%2C%20sans-serif%22%20font-size%3D%2212%22%20font-weight%3D%22600%22%20fill%3D%22%23ef4444%22%3EM40%20cap%20%C2%B7%2016%20GB%20RAM%3C%2Ftext%3E%0A%20%20%3Cpath%20d%3D%22M90%20224%20L360%20222%20Q415%20220%20430%20212%22%20fill%3D%22none%22%20stroke%3D%22%2322c55e%22%20stroke-width%3D%222.5%22%20stroke-linecap%3D%22round%22%2F%3E%0A%20%20%3Cpath%20d%3D%22M430%20212%20C470%20196%20505%20150%20545%20108%20C580%2082%20615%2070%20648%2066%22%20fill%3D%22none%22%20stroke%3D%22%23ef4444%22%20stroke-width%3D%222.5%22%20stroke-linecap%3D%22round%22%2F%3E%0A%20%20%3Cpath%20d%3D%22M548%20108%20C470%20152%20368%20196%20272%20214%22%20fill%3D%22none%22%20stroke%3D%22%23a1a1aa%22%20stroke-width%3D%221.4%22%20stroke-dasharray%3D%224%204%22%20marker-end%3D%22url(%23wsc-arrow)%22%2F%3E%0A%20%20%3Ctext%20x%3D%22404%22%20y%3D%22164%22%20text-anchor%3D%22middle%22%20font-family%3D%22ui-sans-serif%2C%20system-ui%2C%20sans-serif%22%20font-size%3D%2211%22%20font-style%3D%22italic%22%20fill%3D%22%23a1a1aa%22%3Equery%20%2B%20index%20surgery%3C%2Ftext%3E%0A%20%20%3Ccircle%20cx%3D%22560%22%20cy%3D%2298%22%20r%3D%225%22%20fill%3D%22%23ef4444%22%2F%3E%0A%20%20%3Ctext%20x%3D%22560%22%20y%3D%2284%22%20text-anchor%3D%22middle%22%20font-family%3D%22ui-monospace%2C%20SFMono-Regular%2C%20Menlo%2C%20monospace%22%20font-size%3D%2211%22%20font-weight%3D%22600%22%20fill%3D%22%23ef4444%22%3Eseconds%3C%2Ftext%3E%0A%20%20%3Ctext%20x%3D%22572%22%20y%3D%22114%22%20text-anchor%3D%22start%22%20font-family%3D%22ui-sans-serif%2C%20system-ui%2C%20sans-serif%22%20font-size%3D%2211%22%20fill%3D%22%23a1a1aa%22%3Espills%20to%20disk%3C%2Ftext%3E%0A%20%20%3Ccircle%20cx%3D%22250%22%20cy%3D%22222%22%20r%3D%225%22%20fill%3D%22%2322c55e%22%2F%3E%0A%20%20%3Ctext%20x%3D%22250%22%20y%3D%22206%22%20text-anchor%3D%22middle%22%20font-family%3D%22ui-monospace%2C%20SFMono-Regular%2C%20Menlo%2C%20monospace%22%20font-size%3D%2211%22%20font-weight%3D%22600%22%20fill%3D%22%2322c55e%22%3Emilliseconds%3C%2Ftext%3E%0A%20%20%3Ctext%20x%3D%22250%22%20y%3D%22240%22%20text-anchor%3D%22middle%22%20font-family%3D%22ui-sans-serif%2C%20system-ui%2C%20sans-serif%22%20font-size%3D%2211%22%20fill%3D%22%23a1a1aa%22%3Efits%20in%20RAM%3C%2Ftext%3E%0A%3C%2Fsvg%3E)
%22%20x%3D%2228%22%20y%3D%22152%22%20text-anchor%3D%22middle%22%20font-family%3D%22ui-sans-serif%2C%20system-ui%2C%20sans-serif%22%20font-size%3D%2212%22%20fill%3D%22%23746f68%22%3Ep99%20latency%20%E2%86%92%3C%2Ftext%3E%0A%20%20%3Ctext%20x%3D%22376%22%20y%3D%22284%22%20text-anchor%3D%22middle%22%20font-family%3D%22ui-sans-serif%2C%20system-ui%2C%20sans-serif%22%20font-size%3D%2212%22%20fill%3D%22%23746f68%22%3Eworking%20set%20size%20%E2%86%92%3C%2Ftext%3E%0A%20%20%3Cline%20x1%3D%22430%22%20y1%3D%2250%22%20x2%3D%22430%22%20y2%3D%22250%22%20stroke%3D%22%23dc2626%22%20stroke-width%3D%221.5%22%20stroke-dasharray%3D%225%205%22%2F%3E%0A%20%20%3Ctext%20x%3D%22430%22%20y%3D%2244%22%20text-anchor%3D%22middle%22%20font-family%3D%22ui-sans-serif%2C%20system-ui%2C%20sans-serif%22%20font-size%3D%2212%22%20font-weight%3D%22600%22%20fill%3D%22%23dc2626%22%3EM40%20cap%20%C2%B7%2016%20GB%20RAM%3C%2Ftext%3E%0A%20%20%3Cpath%20d%3D%22M90%20224%20L360%20222%20Q415%20220%20430%20212%22%20fill%3D%22none%22%20stroke%3D%22%23cf7928%22%20stroke-width%3D%222.5%22%20stroke-linecap%3D%22round%22%2F%3E%0A%20%20%3Cpath%20d%3D%22M430%20212%20C470%20196%20505%20150%20545%20108%20C580%2082%20615%2070%20648%2066%22%20fill%3D%22none%22%20stroke%3D%22%23dc2626%22%20stroke-width%3D%222.5%22%20stroke-linecap%3D%22round%22%2F%3E%0A%20%20%3Cpath%20d%3D%22M548%20108%20C470%20152%20368%20196%20272%20214%22%20fill%3D%22none%22%20stroke%3D%22%23746f68%22%20stroke-width%3D%221.4%22%20stroke-dasharray%3D%224%204%22%20marker-end%3D%22url(%23wsc-arrow)%22%2F%3E%0A%20%20%3Ctext%20x%3D%22404%22%20y%3D%22164%22%20text-anchor%3D%22middle%22%20font-family%3D%22ui-sans-serif%2C%20system-ui%2C%20sans-serif%22%20font-size%3D%2211%22%20font-style%3D%22italic%22%20fill%3D%22%23746f68%22%3Equery%20%2B%20index%20surgery%3C%2Ftext%3E%0A%20%20%3Ccircle%20cx%3D%22560%22%20cy%3D%2298%22%20r%3D%225%22%20fill%3D%22%23dc2626%22%2F%3E%0A%20%20%3Ctext%20x%3D%22560%22%20y%3D%2284%22%20text-anchor%3D%22middle%22%20font-family%3D%22ui-monospace%2C%20SFMono-Regular%2C%20Menlo%2C%20monospace%22%20font-size%3D%2211%22%20font-weight%3D%22600%22%20fill%3D%22%23dc2626%22%3Eseconds%3C%2Ftext%3E%0A%20%20%3Ctext%20x%3D%22572%22%20y%3D%22114%22%20text-anchor%3D%22start%22%20font-family%3D%22ui-sans-serif%2C%20system-ui%2C%20sans-serif%22%20font-size%3D%2211%22%20fill%3D%22%23746f68%22%3Espills%20to%20disk%3C%2Ftext%3E%0A%20%20%3Ccircle%20cx%3D%22250%22%20cy%3D%22222%22%20r%3D%225%22%20fill%3D%22%23cf7928%22%2F%3E%0A%20%20%3Ctext%20x%3D%22250%22%20y%3D%22206%22%20text-anchor%3D%22middle%22%20font-family%3D%22ui-monospace%2C%20SFMono-Regular%2C%20Menlo%2C%20monospace%22%20font-size%3D%2211%22%20font-weight%3D%22600%22%20fill%3D%22%23cf7928%22%3Emilliseconds%3C%2Ftext%3E%0A%20%20%3Ctext%20x%3D%22250%22%20y%3D%22240%22%20text-anchor%3D%22middle%22%20font-family%3D%22ui-sans-serif%2C%20system-ui%2C%20sans-serif%22%20font-size%3D%2211%22%20fill%3D%22%23746f68%22%3Efits%20in%20RAM%3C%2Ftext%3E%0A%3C%2Fsvg%3E)
So the real task wasn't "click downgrade." It was: shrink the working set and CPU until an M40 fits. Then downgrade. That turned a cost ticket into a performance project. Here's how it went.
Step 1. Forensics: rank query shapes by cumulative cost
You can't optimize what you can't see, and the Atlas Performance Advisor only shows you the recent surface. I wanted the whole picture, so I pulled the raw slow-query logs from all three shards, roughly 38 million log lines across three weeks, and wrote a parser to group them into 2,819 distinct query shapes, ranked by cumulative duration, not single-query latency.


That ranking is the whole game. One slow 2-second query that runs twice a day doesn't matter. A 50ms query that runs 460,000 times does. Sorting by total time spent surfaced the real offenders immediately:
- The single worst shape: 459,801 executions, 31.5 hours of cumulative cluster time, 240 GB of disk reads.
- A
line_itemslookup that was 17.9% of all slow-query time: a collection scan that had cumulatively examined ~107 billion documents to return zero rows. A missing index, hiding in plain sight. - A dashboard aggregation over
accountsaveraging 23.5 seconds (max 45.8s), another 13.5% of slow time.
Those three findings alone accounted for a third of the cluster's pain. None of them showed up as "high CPU." They showed up as disk reads, which is exactly the pressure an M40 can't absorb.
Step 2. Fix the queries before touching the hardware
A couple of anti-patterns explained most of the damage.
The $lookup that can't use an index. Several pipelines joined collections with a let / $expr sub-pipeline. It reads fine, but $expr equality can't use the foreign _id index, so Mongo collection-scans the entire foreign collection, once per input row. One list endpoint was examining ~2.98 million documents to return 10 per page.
// ❌ A let/$expr lookup can't use the foreign _id index,
//    it COLLSCANs the whole foreign collection, once per row.
{ $lookup: {
    from: "accounts",
    let: { aid: "$accountId" },
    pipeline: [{ $match: { $expr: { $eq: ["$_id", "$$aid"] } } }],
    as: "account",
} }

// ✅ localField/foreignField joins DO use the _id index.
{ $lookup: {
    from: "accounts",
    localField: "accountId",
    foreignField: "_id",
    as: "account",
} }
Enrich last, not first. The other recurring sin was paginating after the expensive joins. One list handler ran a 6-month safety-net $match and $lookup-enriched ~100,000 rows per request, then kept 10. Reordering the pipeline to filter, sort, and page down to 10 rows first, and only then enrich, is the single highest-leverage change you can make to a list endpoint.
// ❌ enrich 100k rows, then throw away all but 10
{ $match: filters },
{ $lookup: { /* heavy join across the whole set */ } },
{ $sort: { createdAt: -1 } }, { $skip: 0 }, { $limit: 10 }

// ✅ page down to 10 rows, THEN join
{ $match: filters },
{ $sort: { createdAt: -1 } }, { $skip: 0 }, { $limit: 10 },
{ $lookup: { /* same join, now over 10 rows */ } }

The heaviest dashboard aggregation went from ~23.5 seconds to under 100ms after being inverted this way, and the hottest of these I backed with a short Redis TTL so repeated dashboard loads never hit Mongo at all.
Step 3. Index surgery (in both directions)
Indexes need pruning as much as adding. You need the right ones, and you need to ruthlessly delete the rest, because every index is part of the working set you're trying to shrink, and every index is write amplification on every insert.
So I went both ways:
- Added targeted compound indexes for the offenders from Step 1 (
line_items,documentsonorderId/lineId/itemId, a sparse index onaccounts.profile,stage_runs), and, critically, verified they were actually being used with$indexStatsrather than assuming. An index nobody queries is pure cost. - Removed roughly 244 redundant single-field indexes across 16 collections, mostly prefixes already covered by a compound index, or fields nothing queried by.
Then I fixed the source of the sprawl. Mongoose builds an index for every index: true field on connect, which silently recreates indexes you just dropped, and every developer's laptop does the same against shared environments. The fix is one line:
// Manage indexes explicitly; don't let Mongoose auto-create them
// on every connect (including from dev machines).
mongoose.connect(uri, { autoIndex: false });
This round alone recovered ~43% of cumulative slow-query time and cut ~2 TB/month of unnecessary disk reads.
Step 4. Prove the M40 fits before you click downgrade
I didn't want to downgrade and watch dashboards; I wanted evidence first. So I built a fitness analysis straight from the shard logs that quantified the four things an M40 actually constrains:
- CPU peak (not average: the average was always fine; the question is the peaks).
- Working-set disk-read %: how often reads were already missing cache, the leading indicator of the cliff.
- Connection peaks against the lower M40 connection limit.
- Lock yields, as a contention sanity check.
With the query and index work landed, the model showed the changes had freed ~17–20% of cluster CPU and ~3–5 GB of cache pressure, enough that the working set now sat comfortably under the M40's 16 GB ceiling with headroom at peak. Then I downgraded.
Results


- M50 → M40, a full tier down, a real, recurring cost saving.
- ~43% less cumulative slow-query time and ~2 TB/month fewer disk reads.
- The worst dashboard aggregation: ~23.5s → under 100ms.
- Latency improved through the downgrade: the smaller box runs a leaner workload.
Takeaways
- Right-sizing a database is an optimization problem, not a billing toggle. The savings are real, but you earn them by shrinking the workload first.
- The working set is the currency. Indexes and hot aggregations spend it. Watch disk reads, not CPU averages: disk reads are what a smaller tier can't absorb.
- Rank by cumulative cost. The worst offender is rarely the slowest single query; it's a cheap-looking query run a million times, often a missing index doing a scan that returns nothing.
- Delete indexes, and stop your ORM from re-creating them. Index sprawl is invisible until it's your RAM bill.
- Validate fitness with data before you downsize. Model the peaks, then pull the trigger.
Read next
A Zero-Downtime DigitalOcean → AWS Migration (50k Users)
Moving a live 50,000-user production platform off DigitalOcean and onto AWS without a single customer noticing: rebuilt entirely in Terraform and flipped over with one reversible DNS cutover, with the old stack kept warm as a real rollback net.
The "DELIVERED" That Never Arrived
A notification database was reporting DELIVERED for mail that never arrived. Delivery was recorded the instant SES accepted the API call, not when the message landed, so ~37,000 bounces a day were filed as successes, hiding a steady 52% bounce rate and a bill quietly running at double. The fix was to stop trusting acceptance and wire the real delivery events back on.

The Logged-Off Desktop That Killed 62 of 66 Production Processes
62 of 66 processes on a single Windows box went dark, while disk, RAM, and CPU all read green. The real cause was a runaway terminal exhausting the Windows commit limit, crashing the desktop compositor, and logging off the session every process lived inside. An incident I debugged end to end over AWS SSM, with no RDP.