2026-08-29 • 8 min read
The Date Formatter That Froze a Production Worker
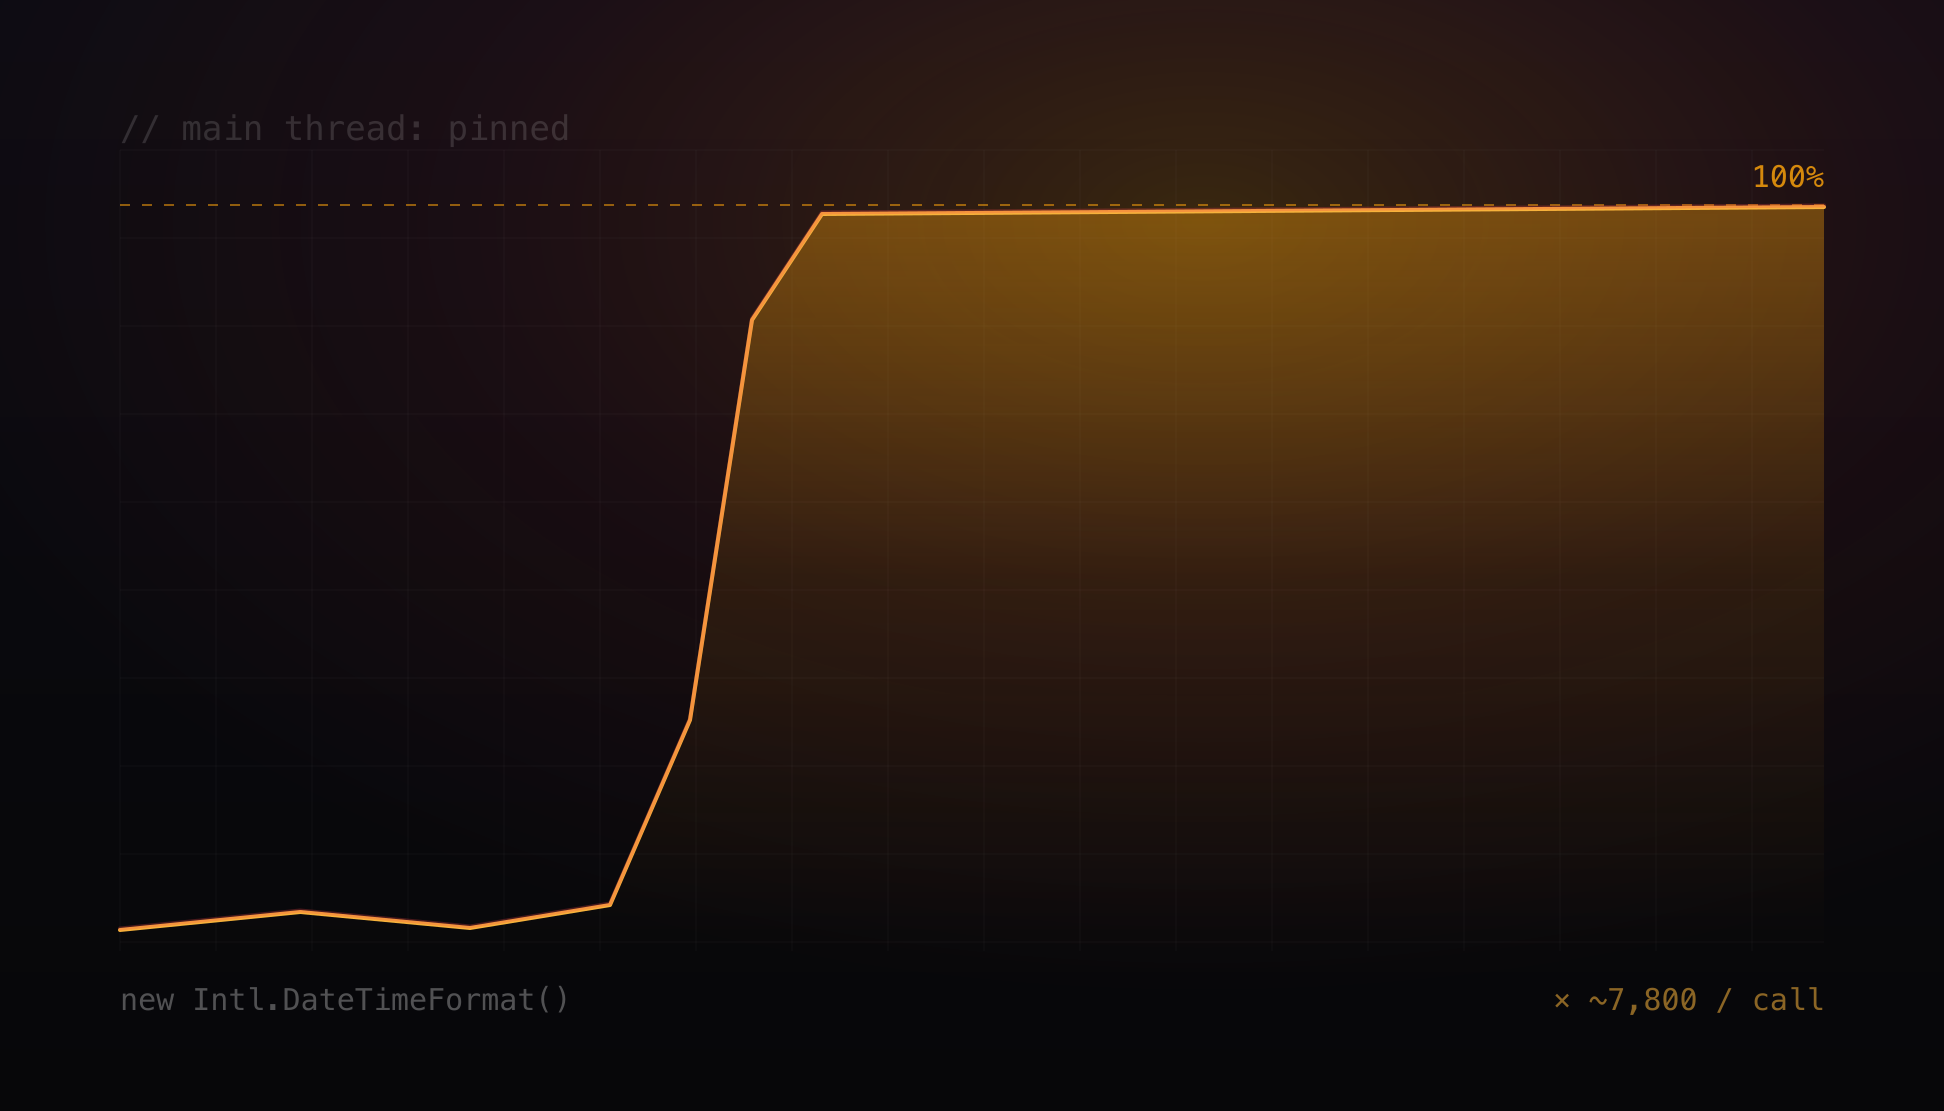
A background worker pinned at 100% CPU, every database call timing out on a pool checkout, and the pool nowhere near full. A blocked event loop makes a jammed process look exactly like an exhausted pool. The cause was a working-hours helper rebuilding a date formatter on every call, still live behind a second door.
The error blamed the database. The database was fine.
A Node.js cron server wedged in production. One CPU core sat pinned near 100%. The process had not crashed. It was simply not making progress, and every database operation it tried was failing after 30 seconds with a connection-pool checkout timeout (waitQueueTimeoutMS).
The obvious reading is pool exhaustion: too many queries in flight, not enough connections, everything queued behind a full pool. That reading even had recent history behind it. A similar-looking incident days earlier had been handled by enlarging the pool.
The numbers did not fit it. During the freeze the pool was nowhere near full: 31 of 80 sockets in use, database ping 5 ms. A pool sitting 60% idle does not time out checkouts.
The tell is in what a checkout actually is. Getting a connection from the driver is asynchronous, and the driver hands it back through a callback on the event loop. A Node process runs your JavaScript on a single thread: V8 executes one call stack, and the event loop can only dispatch the next queued callback once that stack is empty. If some synchronous work is pinning the stack, the loop cannot advance, and every queued callback waits, including the one that would hand back a pooled connection.
%3C%2Ftext%3E%0A%20%20%3Crect%20x%3D%2232%22%20y%3D%22120%22%20width%3D%22268%22%20height%3D%2234%22%20rx%3D%227%22%20fill%3D%22%2318181b%22%20stroke%3D%22%2327272a%22%20stroke-width%3D%221%22%2F%3E%0A%20%20%3Ctext%20x%3D%2248%22%20y%3D%22142%22%20font-family%3D%22ui-monospace%2C%20SFMono-Regular%2C%20Menlo%2C%20monospace%22%20font-size%3D%2212%22%20font-weight%3D%22500%22%20fill%3D%22%23a1a1aa%22%3EwithinWorkingHours()%20scan%3C%2Ftext%3E%0A%20%20%3Crect%20x%3D%2232%22%20y%3D%22162%22%20width%3D%22268%22%20height%3D%2234%22%20rx%3D%227%22%20fill%3D%22%2318181b%22%20stroke%3D%22%2327272a%22%20stroke-width%3D%221%22%2F%3E%0A%20%20%3Ctext%20x%3D%2248%22%20y%3D%22184%22%20font-family%3D%22ui-monospace%2C%20SFMono-Regular%2C%20Menlo%2C%20monospace%22%20font-size%3D%2212%22%20font-weight%3D%22500%22%20fill%3D%22%23a1a1aa%22%3Ejob%20tick%3C%2Ftext%3E%0A%20%20%3Ctext%20x%3D%22372%22%20y%3D%2254%22%20font-family%3D%22ui-sans-serif%2C%20system-ui%2C%20sans-serif%22%20font-size%3D%2210.5%22%20font-weight%3D%22700%22%20letter-spacing%3D%220.5%22%20fill%3D%22%23a1a1aa%22%3EEVENT-LOOP%20QUEUE%20%C2%B7%20waiting%3C%2Ftext%3E%0A%20%20%3Crect%20x%3D%22372%22%20y%3D%2272%22%20width%3D%22312%22%20height%3D%2236%22%20rx%3D%227%22%20fill%3D%22%2318181b%22%20stroke%3D%22%2327272a%22%20stroke-width%3D%221%22%2F%3E%0A%20%20%3Ctext%20x%3D%22388%22%20y%3D%2295%22%20font-family%3D%22ui-monospace%2C%20SFMono-Regular%2C%20Menlo%2C%20monospace%22%20font-size%3D%2212%22%20font-weight%3D%22500%22%20fill%3D%22%23a1a1aa%22%3Etimer%20callback%3C%2Ftext%3E%0A%20%20%3Ctext%20x%3D%22668%22%20y%3D%2295%22%20text-anchor%3D%22end%22%20font-family%3D%22ui-sans-serif%2C%20system-ui%2C%20sans-serif%22%20font-size%3D%2210%22%20fill%3D%22%23a1a1aa%22%3Equeued%3C%2Ftext%3E%0A%20%20%3Crect%20x%3D%22372%22%20y%3D%22118%22%20width%3D%22312%22%20height%3D%2236%22%20rx%3D%227%22%20fill%3D%22%2318181b%22%20stroke%3D%22%2327272a%22%20stroke-width%3D%221%22%2F%3E%0A%20%20%3Ctext%20x%3D%22388%22%20y%3D%22141%22%20font-family%3D%22ui-monospace%2C%20SFMono-Regular%2C%20Menlo%2C%20monospace%22%20font-size%3D%2212%22%20font-weight%3D%22500%22%20fill%3D%22%23a1a1aa%22%3Esocket%20readable%3C%2Ftext%3E%0A%20%20%3Ctext%20x%3D%22668%22%20y%3D%22141%22%20text-anchor%3D%22end%22%20font-family%3D%22ui-sans-serif%2C%20system-ui%2C%20sans-serif%22%20font-size%3D%2210%22%20fill%3D%22%23a1a1aa%22%3Equeued%3C%2Ftext%3E%0A%20%20%3Crect%20x%3D%22372%22%20y%3D%22164%22%20width%3D%22312%22%20height%3D%2236%22%20rx%3D%227%22%20fill%3D%22%2318181b%22%20stroke%3D%22%23ef4444%22%20stroke-width%3D%221.6%22%2F%3E%0A%20%20%3Ctext%20x%3D%22388%22%20y%3D%22187%22%20font-family%3D%22ui-monospace%2C%20SFMono-Regular%2C%20Menlo%2C%20monospace%22%20font-size%3D%2212%22%20font-weight%3D%22700%22%20fill%3D%22%23fafafa%22%3EDB%20pool%20%C2%B7%20checkout%20callback%3C%2Ftext%3E%0A%20%20%3Ctext%20x%3D%22668%22%20y%3D%22187%22%20text-anchor%3D%22end%22%20font-family%3D%22ui-sans-serif%2C%20system-ui%2C%20sans-serif%22%20font-size%3D%2210%22%20fill%3D%22%23ef4444%22%3E30s%2C%20times%20out%3C%2Ftext%3E%0A%20%20%3Cline%20x1%3D%22344%22%20y1%3D%2270%22%20x2%3D%22344%22%20y2%3D%22128%22%20stroke%3D%22%2327272a%22%20stroke-dasharray%3D%223%205%22%2F%3E%0A%20%20%3Cline%20x1%3D%22344%22%20y1%3D%22160%22%20x2%3D%22344%22%20y2%3D%22218%22%20stroke%3D%22%2327272a%22%20stroke-dasharray%3D%223%205%22%2F%3E%0A%20%20%3Ctext%20x%3D%22344%22%20y%3D%22137%22%20text-anchor%3D%22middle%22%20font-family%3D%22ui-sans-serif%2C%20system-ui%2C%20sans-serif%22%20font-size%3D%229.5%22%20fill%3D%22%23a1a1aa%22%3Eloop%3C%2Ftext%3E%0A%20%20%3Ctext%20x%3D%22344%22%20y%3D%22150%22%20text-anchor%3D%22middle%22%20font-family%3D%22ui-sans-serif%2C%20system-ui%2C%20sans-serif%22%20font-size%3D%229.5%22%20fill%3D%22%23a1a1aa%22%3Estalled%3C%2Ftext%3E%0A%20%20%3Ctext%20x%3D%2216%22%20y%3D%22250%22%20font-family%3D%22ui-sans-serif%2C%20system-ui%2C%20sans-serif%22%20font-size%3D%2211.5%22%20fill%3D%22%23a1a1aa%22%3EOne%20thread.%20Until%20the%20stack%20clears%2C%20nothing%20in%20the%20queue%20runs.%20The%20DB%20checkout%20callback%20is%20stuck%20in%20it%2C%20so%20the%20call%20times%20out.%3C%2Ftext%3E%0A%3C%2Fsvg%3E)
%3C%2Ftext%3E%0A%20%20%3Crect%20x%3D%2232%22%20y%3D%22120%22%20width%3D%22268%22%20height%3D%2234%22%20rx%3D%227%22%20fill%3D%22%23fbf5eb%22%20stroke%3D%22%23e7dccd%22%20stroke-width%3D%221%22%2F%3E%0A%20%20%3Ctext%20x%3D%2248%22%20y%3D%22142%22%20font-family%3D%22ui-monospace%2C%20SFMono-Regular%2C%20Menlo%2C%20monospace%22%20font-size%3D%2212%22%20font-weight%3D%22500%22%20fill%3D%22%23746f68%22%3EwithinWorkingHours()%20scan%3C%2Ftext%3E%0A%20%20%3Crect%20x%3D%2232%22%20y%3D%22162%22%20width%3D%22268%22%20height%3D%2234%22%20rx%3D%227%22%20fill%3D%22%23fbf5eb%22%20stroke%3D%22%23e7dccd%22%20stroke-width%3D%221%22%2F%3E%0A%20%20%3Ctext%20x%3D%2248%22%20y%3D%22184%22%20font-family%3D%22ui-monospace%2C%20SFMono-Regular%2C%20Menlo%2C%20monospace%22%20font-size%3D%2212%22%20font-weight%3D%22500%22%20fill%3D%22%23746f68%22%3Ejob%20tick%3C%2Ftext%3E%0A%20%20%3Ctext%20x%3D%22372%22%20y%3D%2254%22%20font-family%3D%22ui-sans-serif%2C%20system-ui%2C%20sans-serif%22%20font-size%3D%2210.5%22%20font-weight%3D%22700%22%20letter-spacing%3D%220.5%22%20fill%3D%22%23746f68%22%3EEVENT-LOOP%20QUEUE%20%C2%B7%20waiting%3C%2Ftext%3E%0A%20%20%3Crect%20x%3D%22372%22%20y%3D%2272%22%20width%3D%22312%22%20height%3D%2236%22%20rx%3D%227%22%20fill%3D%22%23fbf5eb%22%20stroke%3D%22%23e7dccd%22%20stroke-width%3D%221%22%2F%3E%0A%20%20%3Ctext%20x%3D%22388%22%20y%3D%2295%22%20font-family%3D%22ui-monospace%2C%20SFMono-Regular%2C%20Menlo%2C%20monospace%22%20font-size%3D%2212%22%20font-weight%3D%22500%22%20fill%3D%22%23746f68%22%3Etimer%20callback%3C%2Ftext%3E%0A%20%20%3Ctext%20x%3D%22668%22%20y%3D%2295%22%20text-anchor%3D%22end%22%20font-family%3D%22ui-sans-serif%2C%20system-ui%2C%20sans-serif%22%20font-size%3D%2210%22%20fill%3D%22%23746f68%22%3Equeued%3C%2Ftext%3E%0A%20%20%3Crect%20x%3D%22372%22%20y%3D%22118%22%20width%3D%22312%22%20height%3D%2236%22%20rx%3D%227%22%20fill%3D%22%23fbf5eb%22%20stroke%3D%22%23e7dccd%22%20stroke-width%3D%221%22%2F%3E%0A%20%20%3Ctext%20x%3D%22388%22%20y%3D%22141%22%20font-family%3D%22ui-monospace%2C%20SFMono-Regular%2C%20Menlo%2C%20monospace%22%20font-size%3D%2212%22%20font-weight%3D%22500%22%20fill%3D%22%23746f68%22%3Esocket%20readable%3C%2Ftext%3E%0A%20%20%3Ctext%20x%3D%22668%22%20y%3D%22141%22%20text-anchor%3D%22end%22%20font-family%3D%22ui-sans-serif%2C%20system-ui%2C%20sans-serif%22%20font-size%3D%2210%22%20fill%3D%22%23746f68%22%3Equeued%3C%2Ftext%3E%0A%20%20%3Crect%20x%3D%22372%22%20y%3D%22164%22%20width%3D%22312%22%20height%3D%2236%22%20rx%3D%227%22%20fill%3D%22%23fbf5eb%22%20stroke%3D%22%23dc2626%22%20stroke-width%3D%221.6%22%2F%3E%0A%20%20%3Ctext%20x%3D%22388%22%20y%3D%22187%22%20font-family%3D%22ui-monospace%2C%20SFMono-Regular%2C%20Menlo%2C%20monospace%22%20font-size%3D%2212%22%20font-weight%3D%22700%22%20fill%3D%22%23121f35%22%3EDB%20pool%20%C2%B7%20checkout%20callback%3C%2Ftext%3E%0A%20%20%3Ctext%20x%3D%22668%22%20y%3D%22187%22%20text-anchor%3D%22end%22%20font-family%3D%22ui-sans-serif%2C%20system-ui%2C%20sans-serif%22%20font-size%3D%2210%22%20fill%3D%22%23dc2626%22%3E30s%2C%20times%20out%3C%2Ftext%3E%0A%20%20%3Cline%20x1%3D%22344%22%20y1%3D%2270%22%20x2%3D%22344%22%20y2%3D%22128%22%20stroke%3D%22%23e7dccd%22%20stroke-dasharray%3D%223%205%22%2F%3E%0A%20%20%3Cline%20x1%3D%22344%22%20y1%3D%22160%22%20x2%3D%22344%22%20y2%3D%22218%22%20stroke%3D%22%23e7dccd%22%20stroke-dasharray%3D%223%205%22%2F%3E%0A%20%20%3Ctext%20x%3D%22344%22%20y%3D%22137%22%20text-anchor%3D%22middle%22%20font-family%3D%22ui-sans-serif%2C%20system-ui%2C%20sans-serif%22%20font-size%3D%229.5%22%20fill%3D%22%23746f68%22%3Eloop%3C%2Ftext%3E%0A%20%20%3Ctext%20x%3D%22344%22%20y%3D%22150%22%20text-anchor%3D%22middle%22%20font-family%3D%22ui-sans-serif%2C%20system-ui%2C%20sans-serif%22%20font-size%3D%229.5%22%20fill%3D%22%23746f68%22%3Estalled%3C%2Ftext%3E%0A%20%20%3Ctext%20x%3D%2216%22%20y%3D%22250%22%20font-family%3D%22ui-sans-serif%2C%20system-ui%2C%20sans-serif%22%20font-size%3D%2211.5%22%20fill%3D%22%23746f68%22%3EOne%20thread.%20Until%20the%20stack%20clears%2C%20nothing%20in%20the%20queue%20runs.%20The%20DB%20checkout%20callback%20is%20stuck%20in%20it%2C%20so%20the%20call%20times%20out.%3C%2Ftext%3E%0A%3C%2Fsvg%3E)
So every request for a connection waits out the full timeout and fails. There is a free connection sitting right there. There is just nothing running to hand it over. A jammed event loop makes every asynchronous operation time out at once, and the loudest of them, the database, takes the blame.


So the earlier pool bump could never have helped. The pool was never the bottleneck. The loop was, and enlarging the pool just gave the real bug more idle connections to sit in front of.
Profile before you restart
The reflex here is a restart. It works, too: the worker comes back in seconds, the freeze clears, the alerts go quiet. It also throws away the only copy of the evidence. Whatever pinned that core is gone, and it comes back on the next bad input knowing exactly as much as you did the first time.
So before touching it, profile the live process. Node makes this close to free. Send SIGUSR1 to the running process and it opens the V8 inspector on the debug port, the same one node --inspect uses. Attach Chrome DevTools through chrome://inspect, or any CDP client, and record a few seconds of CPU.
A six-second sample settled it: roughly 100% of main-thread time in a single leaf, 6052 ms of a 6000 ms sample (the overshoot is sampling overlap). The stack beneath it was short and unremarkable, a scheduled job calling a working-hours check calling a timezone helper. The leaf was the surprise. The whole process was frozen inside the constructor for a date formatter.
%3C%2Ftext%3E%0A%20%20%3Crect%20x%3D%2216%22%20y%3D%22132%22%20width%3D%22668%22%20height%3D%2234%22%20rx%3D%226%22%20fill%3D%22%2318181b%22%20stroke%3D%22%2327272a%22%20stroke-width%3D%221%22%2F%3E%0A%20%20%3Ctext%20x%3D%2230%22%20y%3D%22154%22%20font-family%3D%22ui-monospace%2C%20SFMono-Regular%2C%20Menlo%2C%20monospace%22%20font-size%3D%2212.5%22%20font-weight%3D%22500%22%20fill%3D%22%23a1a1aa%22%3ElocalMidnight()%3C%2Ftext%3E%0A%20%20%3Crect%20x%3D%2216%22%20y%3D%22172%22%20width%3D%22668%22%20height%3D%2234%22%20rx%3D%226%22%20fill%3D%22%2318181b%22%20stroke%3D%22%2327272a%22%20stroke-width%3D%221%22%2F%3E%0A%20%20%3Ctext%20x%3D%2230%22%20y%3D%22194%22%20font-family%3D%22ui-monospace%2C%20SFMono-Regular%2C%20Menlo%2C%20monospace%22%20font-size%3D%2212.5%22%20font-weight%3D%22500%22%20fill%3D%22%23a1a1aa%22%3EtzParts()%3C%2Ftext%3E%0A%20%20%3Crect%20x%3D%2216%22%20y%3D%22212%22%20width%3D%22668%22%20height%3D%2234%22%20rx%3D%226%22%20fill%3D%22%2318181b%22%20stroke%3D%22%23ef4444%22%20stroke-width%3D%221.8%22%2F%3E%0A%20%20%3Ctext%20x%3D%2230%22%20y%3D%22234%22%20font-family%3D%22ui-monospace%2C%20SFMono-Regular%2C%20Menlo%2C%20monospace%22%20font-size%3D%2212.5%22%20font-weight%3D%22700%22%20fill%3D%22%23fafafa%22%3Enew%20Intl.DateTimeFormat()%3C%2Ftext%3E%0A%20%20%3Ctext%20x%3D%22670%22%20y%3D%22234%22%20text-anchor%3D%22end%22%20font-family%3D%22ui-sans-serif%2C%20system-ui%2C%20sans-serif%22%20font-size%3D%2211%22%20font-weight%3D%22700%22%20fill%3D%22%23ef4444%22%3E6052%20%2F%206000%20ms%20%20%E2%89%88%20100%25%3C%2Ftext%3E%0A%3C%2Fsvg%3E)
%3C%2Ftext%3E%0A%20%20%3Crect%20x%3D%2216%22%20y%3D%22132%22%20width%3D%22668%22%20height%3D%2234%22%20rx%3D%226%22%20fill%3D%22%23fbf5eb%22%20stroke%3D%22%23e7dccd%22%20stroke-width%3D%221%22%2F%3E%0A%20%20%3Ctext%20x%3D%2230%22%20y%3D%22154%22%20font-family%3D%22ui-monospace%2C%20SFMono-Regular%2C%20Menlo%2C%20monospace%22%20font-size%3D%2212.5%22%20font-weight%3D%22500%22%20fill%3D%22%23746f68%22%3ElocalMidnight()%3C%2Ftext%3E%0A%20%20%3Crect%20x%3D%2216%22%20y%3D%22172%22%20width%3D%22668%22%20height%3D%2234%22%20rx%3D%226%22%20fill%3D%22%23fbf5eb%22%20stroke%3D%22%23e7dccd%22%20stroke-width%3D%221%22%2F%3E%0A%20%20%3Ctext%20x%3D%2230%22%20y%3D%22194%22%20font-family%3D%22ui-monospace%2C%20SFMono-Regular%2C%20Menlo%2C%20monospace%22%20font-size%3D%2212.5%22%20font-weight%3D%22500%22%20fill%3D%22%23746f68%22%3EtzParts()%3C%2Ftext%3E%0A%20%20%3Crect%20x%3D%2216%22%20y%3D%22212%22%20width%3D%22668%22%20height%3D%2234%22%20rx%3D%226%22%20fill%3D%22%23fbf5eb%22%20stroke%3D%22%23dc2626%22%20stroke-width%3D%221.8%22%2F%3E%0A%20%20%3Ctext%20x%3D%2230%22%20y%3D%22234%22%20font-family%3D%22ui-monospace%2C%20SFMono-Regular%2C%20Menlo%2C%20monospace%22%20font-size%3D%2212.5%22%20font-weight%3D%22700%22%20fill%3D%22%23121f35%22%3Enew%20Intl.DateTimeFormat()%3C%2Ftext%3E%0A%20%20%3Ctext%20x%3D%22670%22%20y%3D%22234%22%20text-anchor%3D%22end%22%20font-family%3D%22ui-sans-serif%2C%20system-ui%2C%20sans-serif%22%20font-size%3D%2211%22%20font-weight%3D%22700%22%20fill%3D%22%23dc2626%22%3E6052%20%2F%206000%20ms%20%20%E2%89%88%20100%25%3C%2Ftext%3E%0A%3C%2Fsvg%3E)
A date helper, 7,800 times per call
The helper answered one small question: for a given moment, is it inside working hours in a particular timezone? To get there it needed the local start of the day, and to compute that it built a new Intl.DateTimeFormat.
Two things turned that into a bomb.
First, Intl.DateTimeFormat is one of the most expensive objects to construct in V8. Each one spins up ICU's locale and timezone machinery from scratch. Build one and hold onto it and the cost is a rounding error. Build a fresh one on every call and it is not.
Second, the call sat inside a scan. To locate local midnight, the helper walked forward minute by minute: 1,560 iterations in the main loop, plus a 3,120-iteration fallback that formatted twice per step. That is about 7,800 formatter constructions for a single call to the helper. The fallback was meant to be rare. It ran almost every time, because a coarse month-boundary check (a floor division by 31) misfired at the end of longer months.
There was no infinite loop and no runaway recursion here, which is exactly why nothing jumped out at first glance. There was a bounded scan whose per-step cost happened to be one of the heaviest constructors in the runtime.
Then the input made it lethal. A scheduled job walked each pending item day by day, back across however long that item had been waiting. Most items were recent. A few were very old, hundreds of days, up to around 800. One sufficiently stale item drove that 7,800-per-call cost across hundreds of days: millions of formatter constructions, all on the single thread that also runs every timer, every socket, and every database callback. That is where the minutes of freeze came from, and why it hid for so long. It only bit when a stale enough item happened to come through.


The fix: build the formatter once
Two changes, and the first is the one that mattered.
Cache the formatter. Formatters are stateless and safe to reuse, and the set of timezones in play is small and fixed, so they belong in a module-level Map keyed by timezone. The first call for a zone builds one. Every call after that borrows it.
const formatters = new Map();

function formatterFor(timeZone) {
  let fmt = formatters.get(timeZone);
  if (!fmt) {
    fmt = new Intl.DateTimeFormat("en-US", {
      timeZone,
      hourCycle: "h23",
      year: "numeric", month: "2-digit", day: "2-digit",
      hour: "2-digit", minute: "2-digit", second: "2-digit",
    });
    formatters.set(timeZone, fmt);
  }
  return fmt;
}
Delete the scan. Local midnight does not need a minute-by-minute search. Read the timezone's current offset straight from formatToParts, then solve for midnight directly in two passes: seed at local noon, then re-solve at the candidate instant so daylight-saving transitions land on the correct side.
Together they took about 7,800 constructions per call down to zero, plus two formatToParts calls. An item that used to wedge the loop for minutes now resolves in under 500 ms; a thousand back-to-back calls finish in under a second. A regression test pins the performance ceiling so the scan cannot quietly grow back.
The same bomb, behind a second door
The shared, cached helper was not new. An earlier refactor had already extracted these timezone functions into a shared module. It had only rewired some of the callers. The original definitions were still sitting in an older service, still building a formatter per call, still scanning minute by minute, now reached by a different scheduled job. The exact per-call cost that wedged the worker was also live behind a second entrance, waiting on its own stale input.
The fix was to delete the copy and point it at the cached shared version. A partial refactor leaves the old bug running: extracting a helper only counts once every caller is actually on it. Until then the old code is still there, still running, still carrying the original problem. Grep for the old ones before you call the extraction done.
What would have caught it sooner
The signal that should have gone red was event-loop lag. The thing that failed was the loop itself, so the metric that represents this outage is how long the loop takes to come back around, not CPU average and not pool size. A lag probe would have spiked the instant a stale item started its scan and pointed straight at the process. The pool-timeout errors were downstream noise from the same freeze.
A worker like this earns two cheap guards: an event-loop-lag alert, and a ceiling that trips when a single job holds the loop past a threshold. With either one in place, the next occurrence announces itself on the way in, instead of being reconstructed from a six-second sample after the fact.
Takeaways
- The loudest error names a symptom, not a cause. A blocked event loop makes every asynchronous call time out, so a connection-pool checkout timeout can mean the loop is jammed rather than the pool being full. Check event-loop lag and pool utilization before you reach for a bigger pool.
- Profile before you restart. A restart clears the freeze and deletes the evidence, and the problem returns on the next bad input. Send
SIGUSR1, attach a profiler, capture a few seconds of CPU, and let the flame graph name the hot leaf. - Never construct
Intl.DateTimeFormaton a hot path. It is one of V8's most expensive constructors. Build one per timezone, cache it in a module-level map, and reuse it. Formatters are stateless. - A cheap operation becomes an outage when you multiply it enough. Roughly 7,800 constructions per call across hundreds of days is millions of them on a single thread. Watch for a per-call cost sitting inside a scan sitting inside a large input.
- A half-finished refactor leaves the old bug running. If you extract a helper, move every caller onto it and delete the original. Searching for the new name hides the callers you never migrated, so grep for the old ones before you call it done.
- Monitor the thing that can actually fail. The loop was the failure, so event-loop lag is the metric. If you cannot point at the number that would go red in this outage, you are watching the wrong one.
Sources
- Node.js:
processsignal events.SIGUSR1is reserved to start the V8 inspector on a running process. - MDN:
Intl.DateTimeFormat. The constructor whose per-call cost wedged the loop.
Read next
The Download Proxy Hiding in Your Browser
Archiving a few hundred wallpapers turned into a standoff with Cloudflare that curl and gallery-dl kept losing with a 403. The way through was a browser capability most scraping never touches, and the archive turned out to be rotting faster than I could save it.
The Boot Race That Killed 45 of 46 Consumers
A routine host reboot brought a notification service back up in seconds (healthy, green, 200 OK) while 45 of its 46 message-queue consumers were dead and had been since the moment it started. The broker's AMQP listener opened 38 seconds after boot; every consumer had already dialed once, hit ECONNREFUSED, and disabled itself without retrying. The health check couldn't see any of it, because it watched the process, not the work.
Right-Sizing a Production MongoDB Cluster: M50 → M40
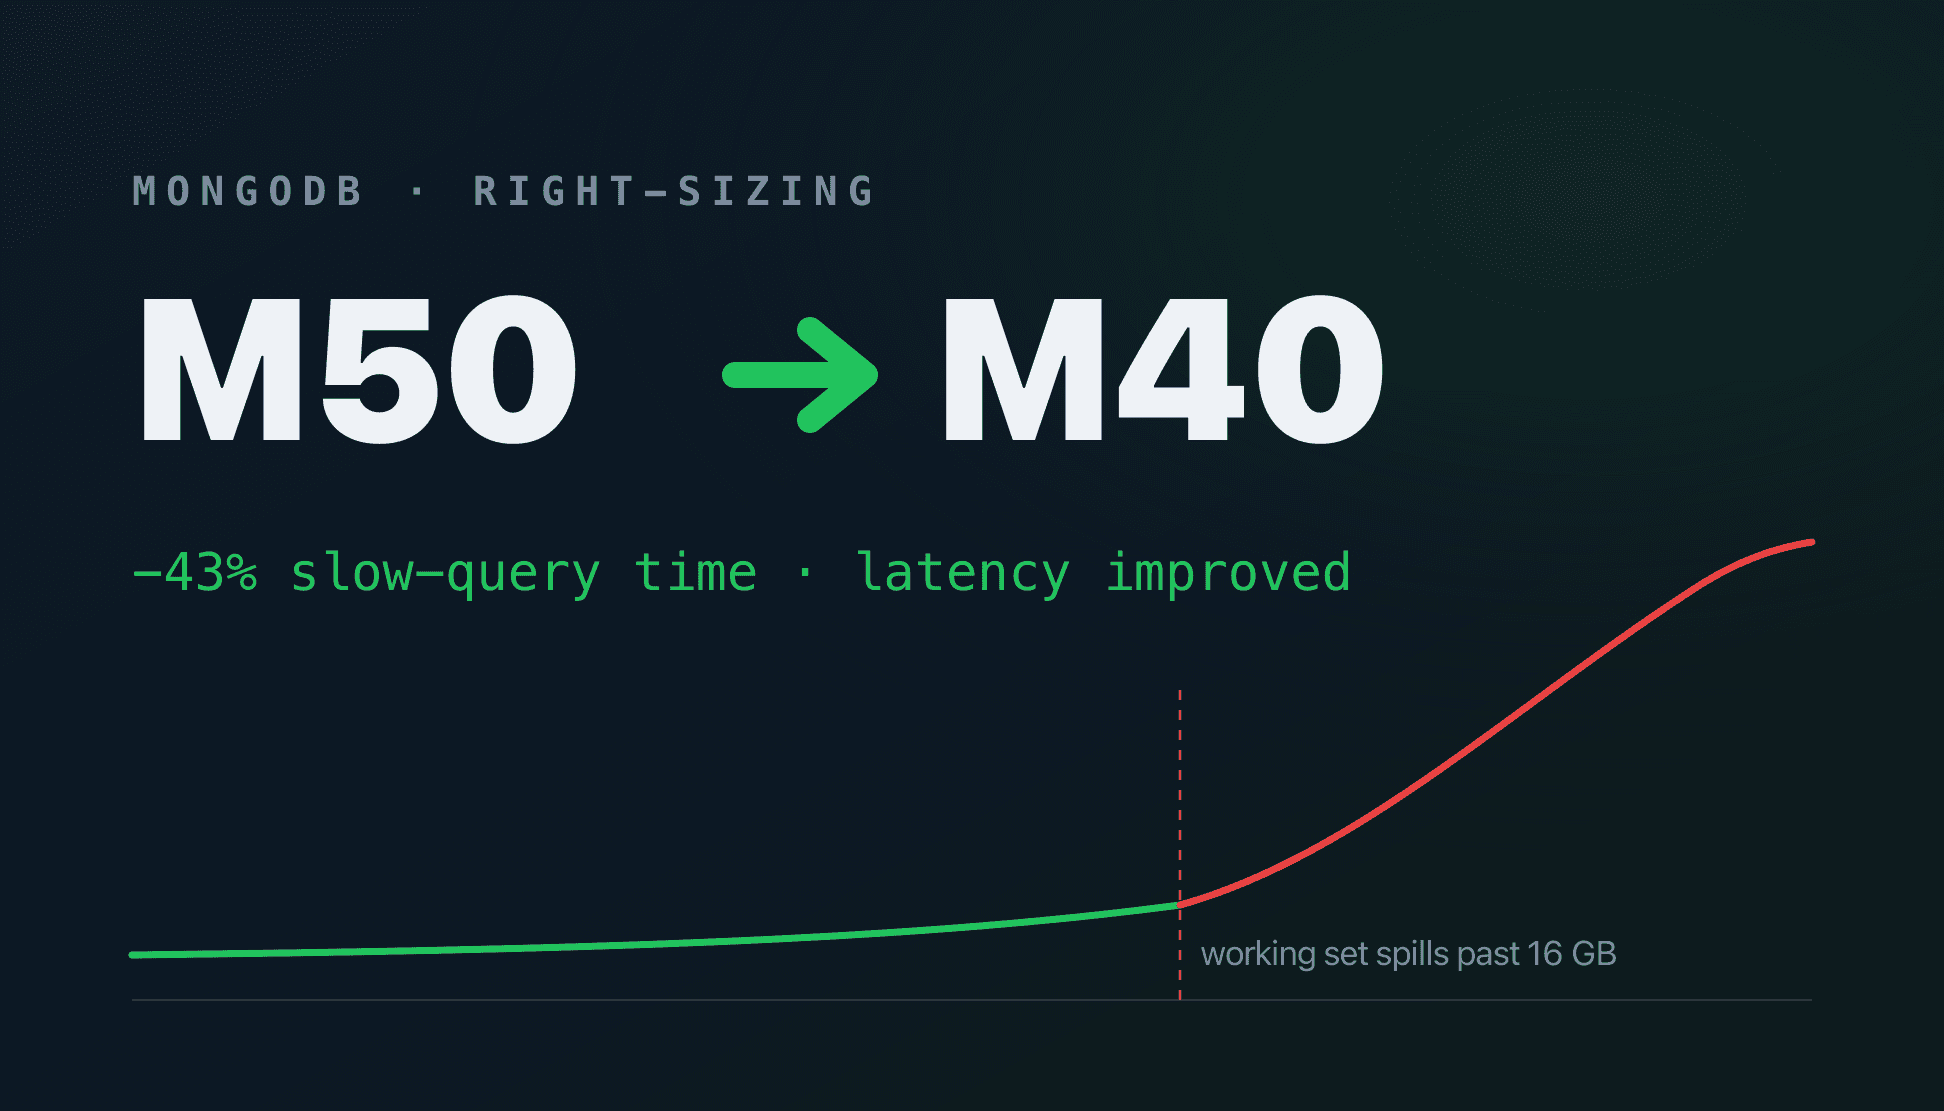
You can't just click "downgrade" on a production database. Here's the log forensics, index surgery, and aggregation rewrites that shrank the working set enough to take a MongoDB Atlas cluster from M50 to M40, a full tier down, slow-query time down ~43%, and latency that improved through the cut.